Quick Stats

Age Demographics
Age Demographics
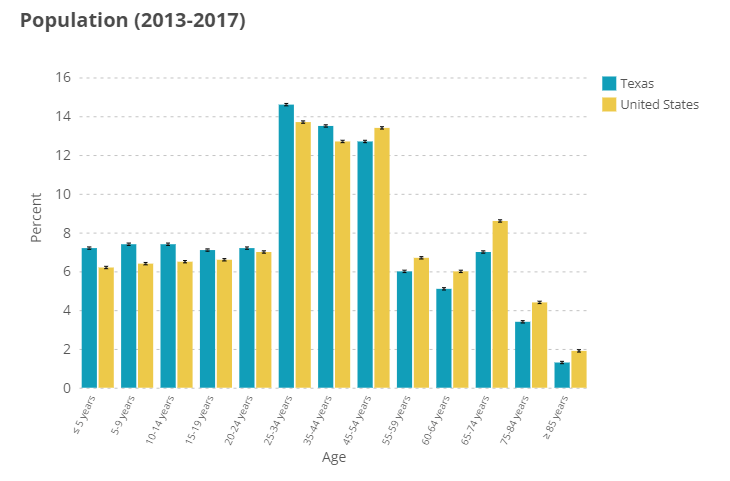
Texas has a higher percentage of individuals in the 25-34 and 35-44 year ranges compared to the United States as a whole.
The age range of 20-44 is an important age range because it is the prime childbearing age group and growth in this range ensures future community vitality.
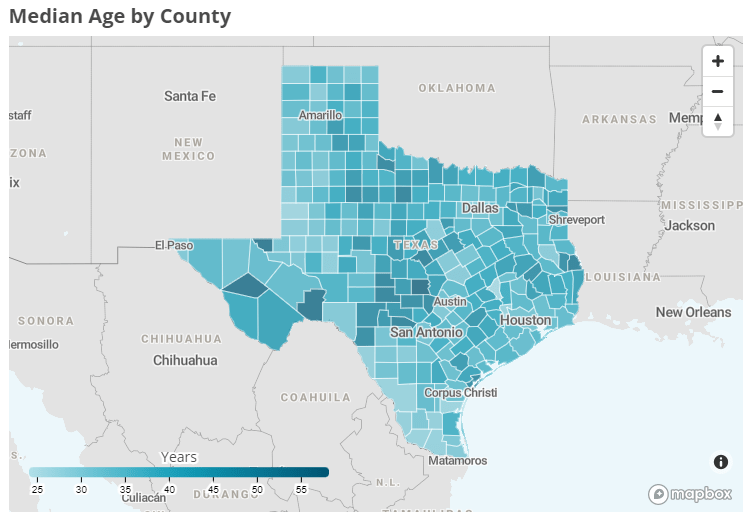
The median age in Texas varies by county. Median age is again an important factor when thinking about many aspects of a healthy community including community vitality and health care costs and utilization.
Race and Ethnicity
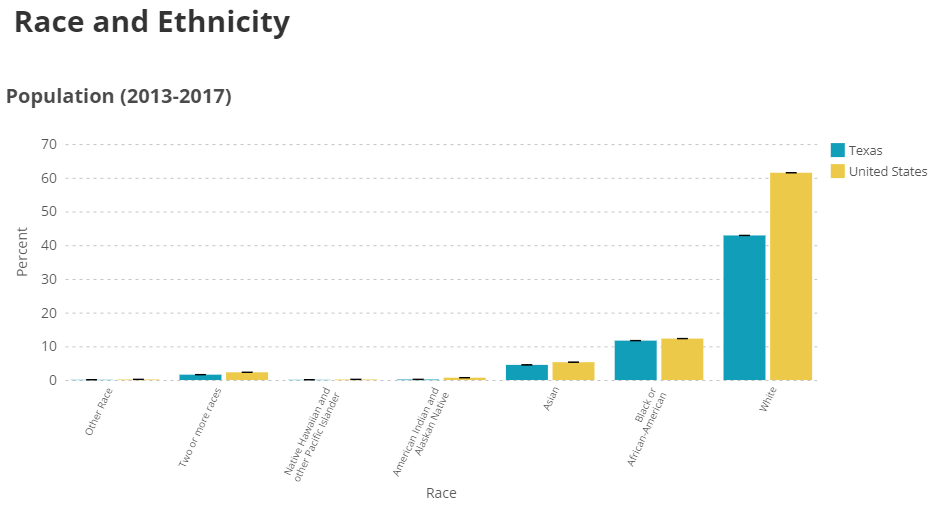
 The ACS adheres to definitions of race and ethnicity set forth by the 1997 Office of Management and Budget (OMB) standards. These categories are based on self-identification and are “not an attempt to define race biologically, anthropologically, or genetically,” according to the Census Bureau.
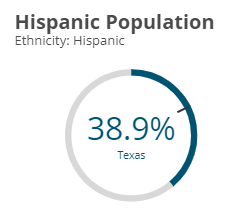
According to the OMB standards, the category of “Hispanic” maps to the concept of ethnicity, not race, and so is not included in this chart. A person who identifies as Hispanic may be of any race or combination of races.
Educational Attainment
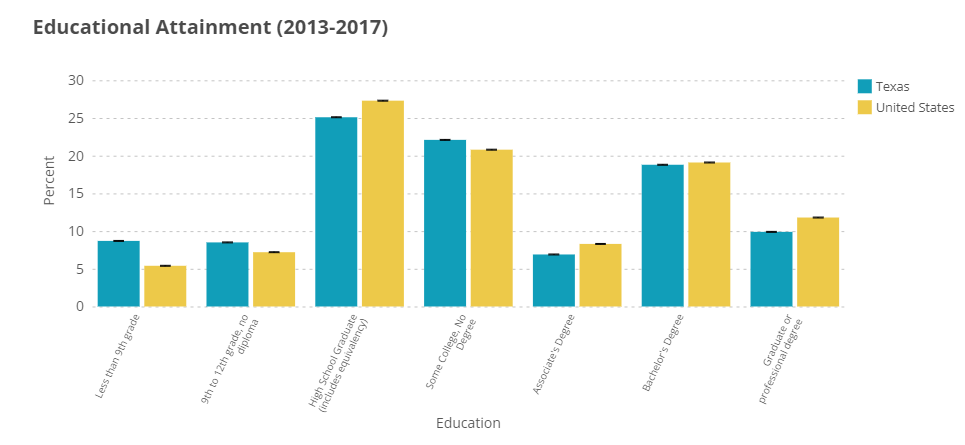
Educational attainment refers to the highest grade level or degree that an individual has completed. The data shown here only includes the population age 25 and over. In general, Texas has higher percentage of individuals with less than 9th grade education, high school education but no diploma, and some college but no degree groups compared to the United States as a whole.
Environmental Factors
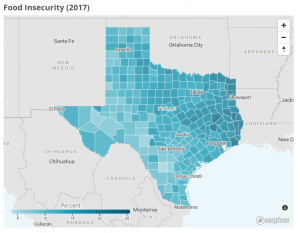 Food insecurity measures the percent of households lacking consistent access to adequate healthy food. Households with extreme food insecurity may face hunger. The map below, based on data from Feeding America: Map the Meal Gap, compares rates of food insecurity across states.
Food insecurity varies in Texas by county. In general, eastern Texas counties face higher percentages of households that are facing food insecurity.
Food Insecurity among Seniors
While food insecurity is a concern among any population, “food-insecure seniors are a group of particular concern given their poor health outcomes put them at greater risk”. Food insecurity among seniors (60+ years of age) in Texas has been on the rise since 2016. Texas ranked in the top ten for states with the most food insecure seniors for the past two years and is consistently above the national average. In 2018, 10.7% of seniors in Texas were food insecure.
Food Insecurity & COVID
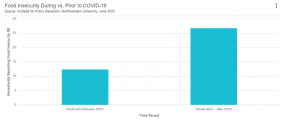
The Institute for Policy Research at Northwestern University published a study on the estimated impact of COVID-19 on food insecurity. They found that food insecurity rates are increased in every state, though the amount of increase varies. Food insecurity in Texas was at 26.8% for April-May 2020 which just over double the estimate for February 2020. 8.2% of households in Texas reported that they had received free food from any source in the prior seven days, compared to 7.3% of households across the United States.
To learn more about the study and methodology used, click here.


The map above is supported by a Council research study that focuses on the population of individuals with disabilities. This report was updated in 2019. Entitled People with Disabilities: A Texas Profile, this report details the demographic characteristics of the population of individuals with disabilities in Texas.

The picture on the right shows the locations of Texas’ military bases. Veterans are an important population of interest, especially when veterans frequent suffer from service-connected disabilities.
Source: Texas Comptroller’s Data Analysis and Transparency Division.
The following percents are from the Behavioral Risk Factor Surveillance System (BRFSS) where respondents were asked if they have serious difficulty walking or climbing stairs.
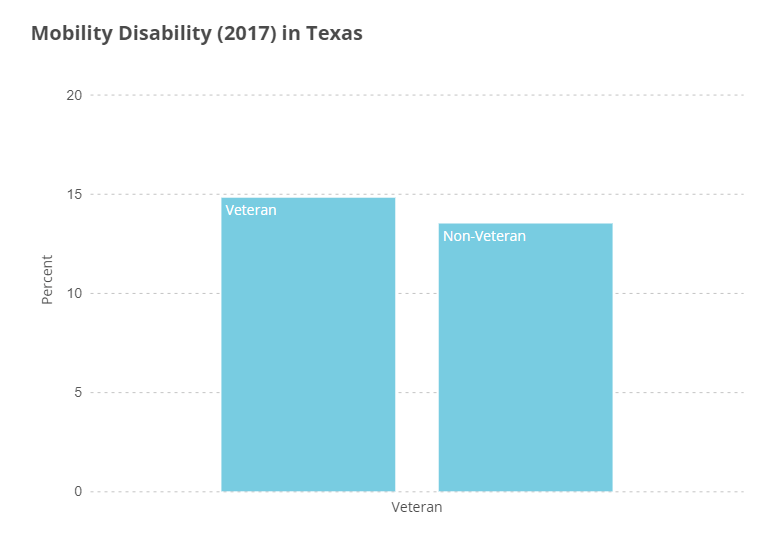
The following percents are from the Behavioral Risk Factor Surveillance System (BRFSS) where respondents were asked if they have serious difficulty walking or climbing stairs.
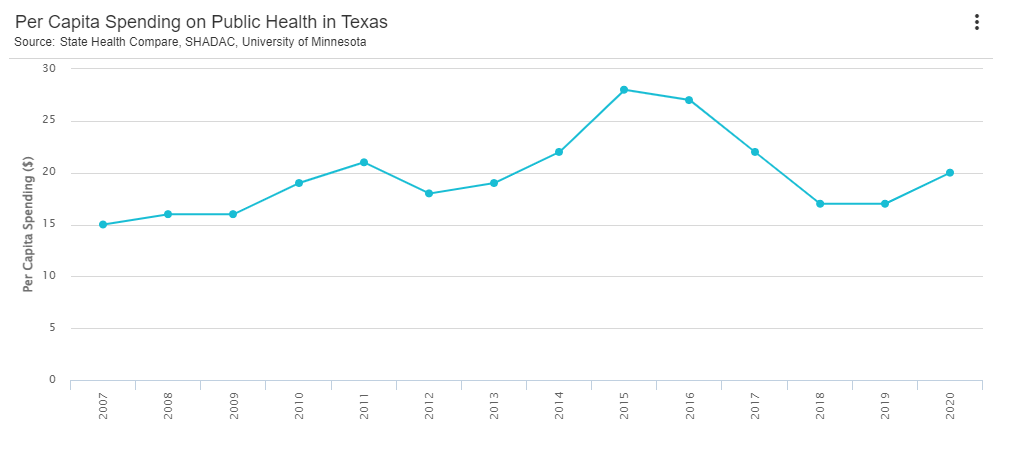
Per Capita Spending on Public Health
Per capita spending on public health is an indicator of a community’s preparedness to respond to public health emergencies, ability to implement prevention programs for chronic diseases, substance abuse, etc., and ability to surveil public health data to combat both communicable and non-communicable diseases. While more money does not necessarily imply “significant and sustainable health gains” an increase in public health spending has been associated with decreases in mortality rates from preventable causes of death.
The chart below shows per capita spending on public health in Texas over the past 13 years. Spending was on the rise until 2015, but in 2016 it took a sharp downwards turn. Per capita spending has now dropped close to the amount that was being spent during 2010-2011.