Obesity occurs when persons take more calories than are burned by exercise. An excessive amount of body fat increases the risk of long term health problems that could affect daily life.
Obesity occurs when persons take more calories than are burned by exercise. An excessive amount of body fat increases the risk of long term health problems that could affect daily life.
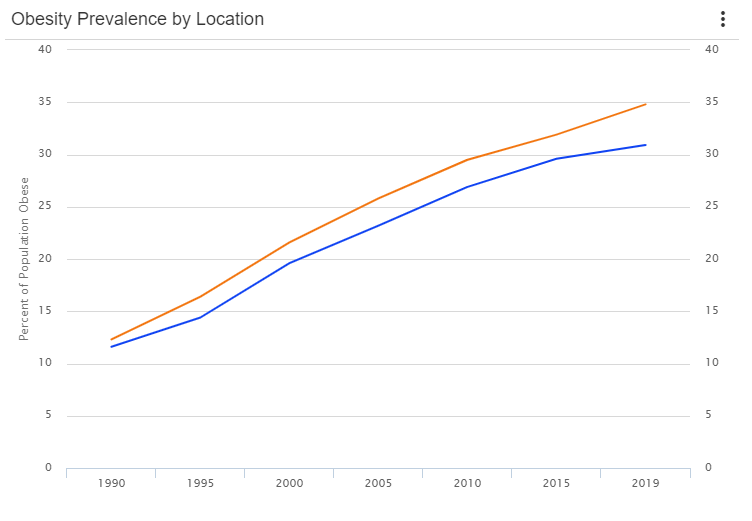
From 1990-2019, Texas has had a higher obesity rate compared to the U.S. overall. In 2019, 34.8% of Texans were obese compared to 30.9% of Americans. The number of diabetes cases in the last decade amounted to 1,962,059 and it is projected that by 2030, there will be about 2,851,687 diabetes cases. Diabetes, hypertension rates, heart disease and obesity-related cancer cases are said to rise significantly by 2030. The highest of these rates being heart disease cases from 1,261,654 to 5,688,482.


Behind the Story

According to Healthy People 2020, most Americans do not eat a healthful diet and are not physically active. America’s Health Rankings reports that as of 2019, the obesity rate among adults is 34.8% compared to the national average rate of 30.9%. Texas currently ranks 10th in obesity among all US states.
Adolescents have been shown to have a lower intake of fruits and vegetables than adults. For this reason, childhood obesity has been a growing concern in the past years. Childhood obesity is a condition in which a child is significantly overweight for his or her age and height.
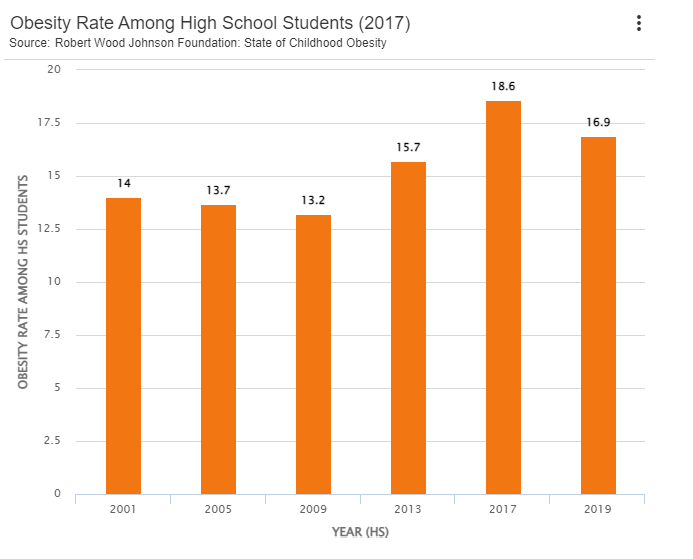
As of 2019, the obesity rate for 10 to 17 year old children is 20.3% and among high school students, these numbers have increased significantly. Among US states, Texas ranks 8th when it comes to obesity rates among high school students. From 2013 to 2017, a 2.9% increase was seen among high school students, but then between 2017 and 2019 there was a 1.7% decrease in obesity among high school students. Some of the state regulations that could have contribute to this decrease include requiring licensed Early Childhood Education programs to make drinking water available to children, schools requiring participation in physical education, and funding for healthy food in schools.


The BRFSS reported obesity rates by age groups in 2020. The chart on the right shows that the highest rates of obesity reported were seen among 45 to 54 year old adults and the lowest rates were among 18 to 24 year-old young adults.

The highest rate of obesity was seen among adults of “Other” race at a rate of 43.3%. This Black adults who averaged a 41.3% obesity rate. Hispanic adults followed with a rate of 40.4%.
Contributing Factors
There are many causes of obesity. Some common causes include insufficient sleep, unhealthy behaviors such as lack of exercise, and an unhealthy diet. The charts below show the percentage of Texas adults that self-reported insufficient sleep ( < 7 hours in a 24-hour period), no physical exercise in the past 30 days, and consuming two or more fruits and three or more vegetables daily.

Over 30% of Texas adults consistently self-report getting less than 7 hours of sleep in a 24-hour period. According to the CDC, adults need at least 7 hours of sleep per night, with some age groups needing more.
Compared to the United States average, more Texas adults self-reported no physical activity in the past 30 days. In 2019, 27.2% of Texas adults were physically inactive. From 2014-2019, adults with an income level of less than $25,000 had the highest prevalence of physical inactivity. Adults at this income level consistently had around 40% of the population self-report physical inactivity. In the chart below, the prevalence of adults reporting no physical activity decreased as income level increased, with the lowest prevalence at the $75,000 or more level.


90% of Texas adults self-reported not meeting the recommended intake of fruits and vegetables in 2019.
Texas Obesity Resources
Treating obesity includes making changes to diet and incorporating regular exercise into ones daily routine. By making these changes, you reduce the risk of developing serious health conditions, such as high blood pressure, high cholesterol, diabetes, heart disease, stroke and cancer.
Organizations like the CDC and the Texas Department of State Health Services provided resources and materials that can be used to help diabetic patients manage their diabetes and to provide information about preventing diabetes.


