Texas Oral Health Report Card
Texas Oral Health Coalition
Select Indicator Trends

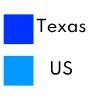
Legend
Indicator 3
Indicator 3: | ||||
| TX | US | Diff | Grade | Data |
| 47.57 | 35.73 | 28.43 | A | 2010 |
| 48.92 | 36.52 | 29.03 | A | 2011 |
| 46.95 | 37.59 | 22.14 | A | 2012 |
| 46.72 | 38.35 | 19.68 | B | 2013 |
| 46.27 | 39.54 | 15.69 | B | 2014 |
| 56.66 | 40.88 | 32.36 | A | 2015 |
| 60.71 | 42.18 | 36.02 | A | 2016 |
| 73.3 | 43.2 | 51.7 | A | 2017 |
| 61.2 | 43.3 | 34.3 | A | 2018 |
| 60.6 | 43.9 | 32 | A | 2019 |
| 53.6 | 36.6 | 37.15 | A | 2020 |
| 59.1 | 40.6 | 37.1 | A | 2021 |
Indicator 7
| Indicator 7: Children ages 1-5 with decayed teeth or cavities in the last year | ||||
| TX | US | Diff | Grade | Data |
| 12 | 7.7 | -43.65 | F | 2016-2017 |
| 12.9 | 7.7 | -50.49 | F | 2017-2018 |
| 7.9 | 6.9 | -13.51 | D | 2018-2019 |
| 7.7 | 7.1 | 8.11 | C | 2019-2020 |
| 10.9 | 7.8 | -33.16 | F | 2020-2021 |
Indicator 8
| Indicator 8: Children ages 6-11 years old with decayed teeth or cavities in the last year | ||||
| TX | US | Diff | Grade | Data |
| 19.4 | 16.7 | -14.96 | D | 2016-2017 |
| 20.5 | 16.9 | -19.25 | D | 2017-2018 |
| 15.3 | 16.8 | 9.35 | C | 2018-2019 |
| 16.8 | 16.9 | 0.59 | C | 2019-2020 |
| 17 | 17.3 | 1.75 | C | 2020-2021 |
Indicator 9
Indicator 9: | ||||
| TX | US | Diff | Grade | Data |
| 27.4 | 26.9 | 1.84 | C | 2016-2017 |
| 22.5 | 25.6 | -12.89 | D | 2017-2018 |
| 21.1 | 23.1 | -9.05 | C | 2018-2019 |
| 22.1 | 21.6 | 2.29 | C | 2019-2020 |
| 25.6 | 20.5 | 22.13 | A | 2020-2021 |
Indicator 12
| Indicator 12: Adults with diabetes who had a dental visit in the last year | ||||
| TX | US | Diff | Grade | Data |
| 44.4 | 58.2 | -26.9 | F | 2012 |
| 51.1 | 57.4 | -11.61 | D | 2014 |
| 53.4 | 59.5 | -10.81 | D | 2016 |
| 49.5 | 60.6 | -20.16 | D | 2018 |
| 38.8 | 59.9 | -42.76 | F | 2020 |
Indicator 15
| Indicator 15: Adults aged 65+ who have lost all of their natural teeth due to tooth decay or gum disease | ||||
| TX | US | Diff | Grade | Data |
| 13.4 | 16.2 | 18.92 | B | 2012 |
| 12.3 | 14.9 | 19.12 | B | 2014 |
| 13.7 | 14.4 | 4.98 | C | 2016 |
| 13.7 | 13.8 | 0.73 | C | 2018 |
| 13.7 | 13.8 | 0.73 | C | 2020 |
Indicator 17
| Indicator 17: Needs met in Dental Health Provider Shortage Areas (DHPSA) | ||||
| TX | US | Diff | Grade | Data |
| 61.1 | 38.4 | 45.6 | A | 2016 |
| 75.3 | 25.7 | 98.2 | A | 2017 |
| 45.9 | 29.3 | 44.1 | A | 2018 |
| 44.6 | 29.8 | 39.8 | A | 2019 |
| 43.4 | 29.3 | 38.8 | A | 2020 |
| 42.4 | 30.8 | 31.69 | A | 2021 |
| 41.4 | 31.8 | 26.23 | A | 2022 |
| 41.4 | 32.1 | 25.31 | A | 2023 |


